Case Study: Analyzing and Forecasting City Water Consumption
Client: U.S. Mid-sized Municipal Water Authority
Project Focus: Analyze water usage to develop forecasting model and identify water waste
Role: Lead Analyst (statistical model buildout, analytical insights)
I. The Challenge
The municipality wanted to better understand how water consumption patterns changed over time and if—and where—faulty water meters were leading to waste water and missed city revenue. Additionally, the municipality wanted to identify the effects of seasonality on water consumption and what impact Covid had. However, their data had some challenges:
Inaccurate, inconsistent, and/or missing meter readings
No adjustment for seasonality or changes in usage
Unknown impact of Covid on usage rates or population shift
The municipal water authority wanted to identify consumption trends to help build a reliable forecast for the future that accounted for real-world variables such as economic disruptions, leakages, and the pandemic.
II. The Solution
Ben partnered with the municipal water authority’s data team to develop a reliable forecasting model:
1. Data Cleanup and Validation
Filled missing or null values with a rolling, 3-month seasonal average
Flagged anomalous data as potential meter downtime and/or reporting gaps
2. Modeling Consumption and Adjusting for Covid
Compared prior years usage with usage during Covid
Filtered based on meter location, residential or commercial zoning, and time of day
Built out scenarios around return-to-normal and continued lockdown
3. Seasonality and Weather Impact
Layered in historical temperature and precipitation averages
Built regression models that captured peak summer demand and baseline winter usage
4. Building the Forecasting Framework
Developed a three-scenario forecast for best case, conservative, and stress-testing using:
Seasonal consumption averages
Economic activity data and assumptions
Base rates and adjusted rates per neighborhood and commercial zone
Delivered an interactive dashboard and presented an executive-level summary to the municipal water authority and our CEO
III. The Outcome
The municipal water authority gained a valuable data-driven water usage forecast for short- and long-term planning
The forecast improved accuracy by ~35% when compared to prior static projections
Data cleanliness was improved by ~80%
The findings of the project helped influence municipal maintenance scheduling, water conservation policy discussions, and validated the importance of our services
IV. Why It Mattered
This Project provided data-driven confidence and decision clarity in infrastructure planning, resource allocation, and mitigating wasteful water usage. By incorporating statistical methodologies with real-world scenarios, Ben helped the city identify what wasn’t working and prepare for the future, even in uncertain times.
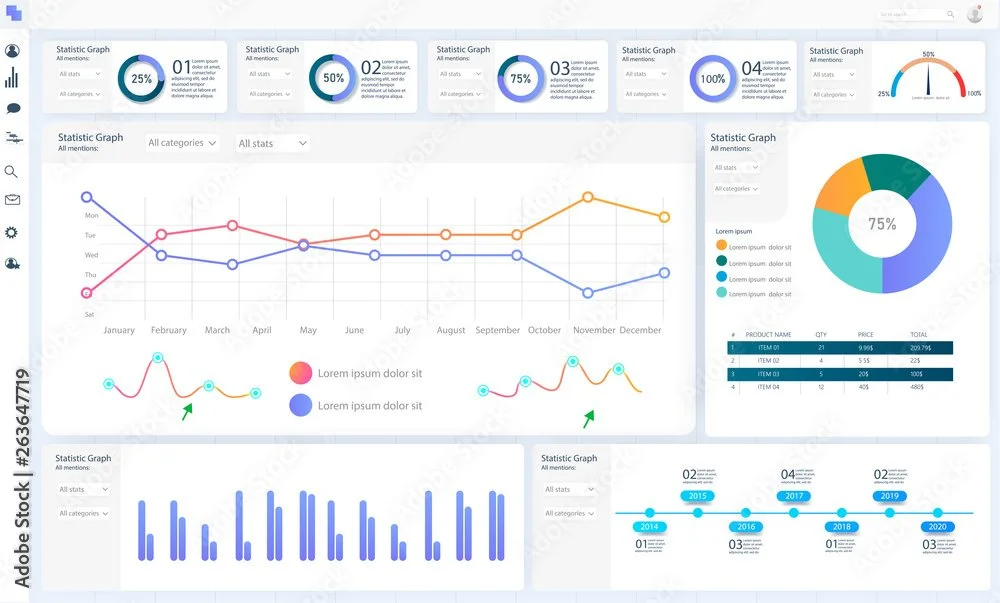
Examples of how we can elevate your forecast
-
![]()
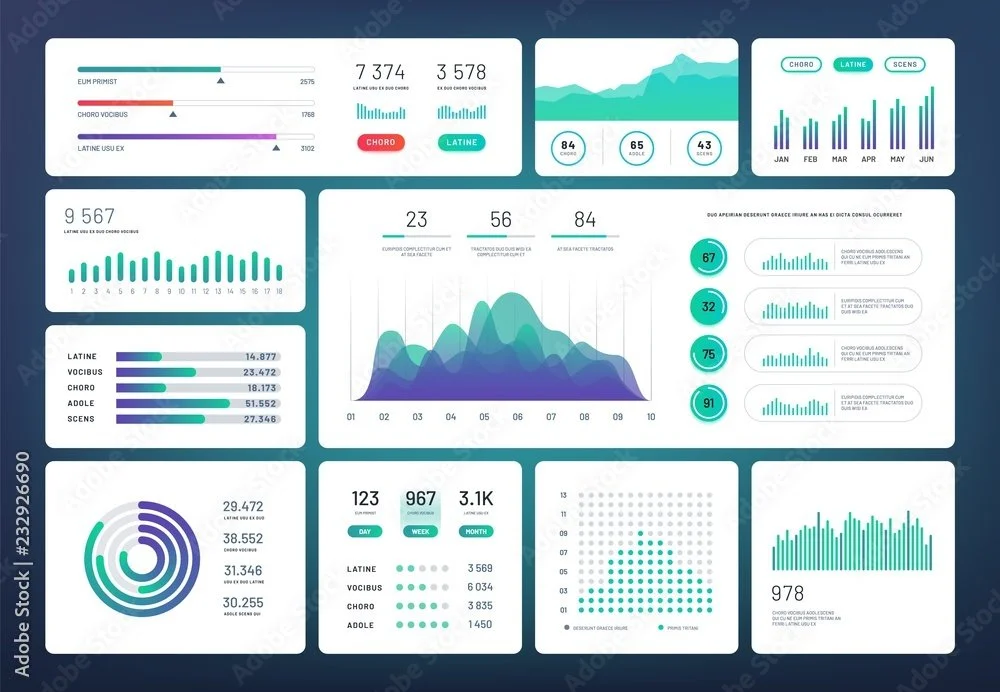
How are things looking from a high level
-
![]()
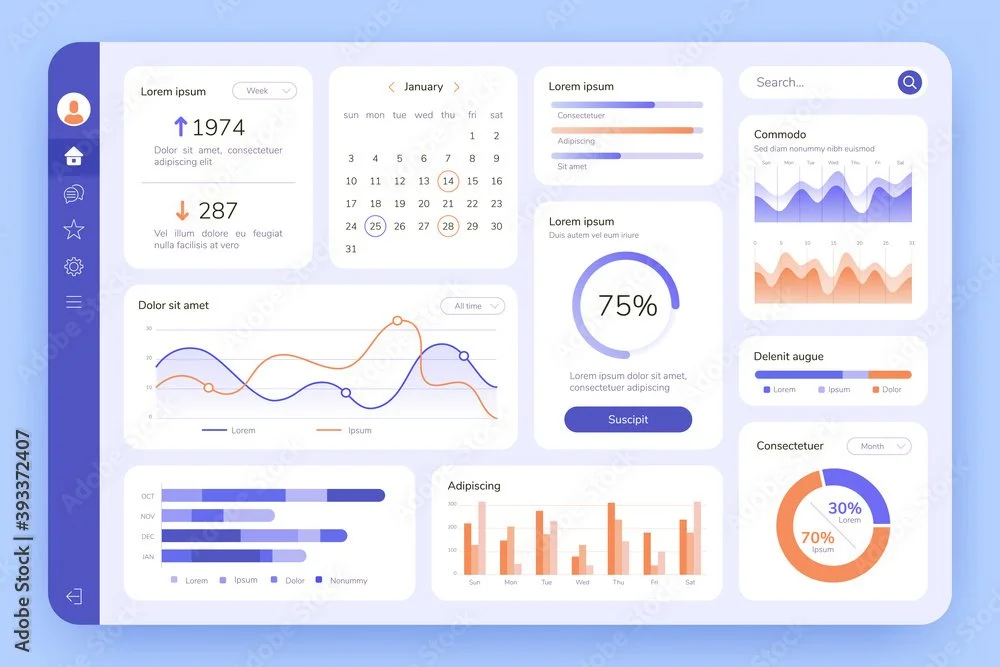
Current and future outlooks based on real data
-
![]()
Behind the scenes
-
![]()
Historical insights to help plan for the future